A common assumption when troubleshooting cloud application performance is that a network fault is the root cause. But that turns out to be the case less than 50% of the time. Fortunately there is a super quick way to verify one way or the other if you run Juniper SRX Firewalls. JunOS has a little known feature called RPM (Real-Time Performance Monitoring) probes.
RPM probes can regularly mimic common network communications while measuring their performance. A probe can ping a host, mimic a voice call between two routers, or request a web page. By simulating an application’s communication, a benchmark metric indicating the expected user experience can be obtained. This is very useful when monitoring cloud services. By creating a regular HTTP GET test for Office365, you can see at a glance if there is a network issue between the router and the cloud application. The tests can be run frequently and results cached on the router. The results may also be polled via SNMP to be collected and graphed by a Network Management System.
JunOS RPM probes can give insight into historical and current state of network communication. Running them directly from the routing platforms will help to rule out other performance influences such as application, disk or CPU that would be unique to a server or desktop. Only one or two need to be run, checking the critical cloud apps, or testing the health of the critical WAN paths.
*It’s important not to abuse the cloud service through rapid and repetitive requests otherwise the IP address may blocked for abuse*.
Here is a CLI configuration example of a rpm probe testing for the Office365 page for responsiveness.
[snippet id=”26″]
The probe is set up to request the main page five times, every ten seconds. This test set defines the probe, which runs every 5 minutes. A probe failure is considered to be either four consecutive tests of total loss, or an average round trip time exceeding 300 milliseconds. The probe failure will then trigger an SNMP Trap which will log the event and send notification to a Network Management System. Results of each test are cached, averaged, consolidated and visible via the J-Web UI. Historic results are also available via SNMP. At a glance you can quickly ascertain the health of the network, and then focus on troubleshooting the appropriate system.

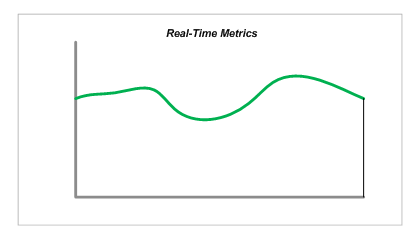
Juniper RPM Probe Graph
If you have a large deployment of SRX routers, probes can be run at many points all over the network. This provides a global representation of the expected user experience at any point on the network. These metrics can then be compared to the actual or reported user experience, providing further direction if troubleshooting is needed. You may also gain other useful insights when comparing with other metrics. For example, comparing peak traffic graphs with the historical probe results can show whether high usage is impacting the service experience.
For an organizations relying on cloud services, this tool is very helpful. In the next article, we will show how JunOS RPM probes may be used to autonomously react and respond. A router can intelligently route around a network issue and react quickly to anomalous events. More on that soon.
Thanks for reading!